
Computers, AI, and Return Predictability
More technology, more pattern discovery, more alpha erosion

A typical pattern in empirical asset pricing research over the last decades goes something like this. Academics need to publish. They analyze thousands of variables to find the ones that explain or predict returns in the cross-section. Some are published because they appear to predict returns. Others because they come with a compelling economic story. This is the mechanism that has produced the factor zoo: a collection hundreds of candidates for being the drivers of equity returns.
But academics are not doing this in a vacuum. Asset managers need to make money for their clients. Some of them (active managers, hedge funds) do this by exploiting signals to hopefully outperform the market. As a group, they are also collectively looking for variables that are drivers of returns, and there is a large overlap between the sets of variables that practitioners and academics look at. There is also a lot of “cross-pollination”, as finance academics often consult in the industry. Top quant shops also have an interest in publishing (some) of their findings to gain prestige and legitimacy.
At the same time, practitioners have little incentive to disclose strategies that are not already widely known, especially if they have limited capacity. This helps explain why there is so much research on well-known anomalies like value and momentum, while other types of strategies remain largely opaque, occasionally becoming public over time. A well-known example is the use of satellite imagery to monitor parking lot traffic at large retail stores. By tracking the number of cars outside chains such as Walmart or Target, investors can infer store-level activity and anticipate earnings surprises. Evidence suggests that such signals can generate economically meaningful abnormal returns around earnings announcements.
As computing power and data availability expand, the search for return predictors accelerates. The natural question is what this implies for return predictability.
Does Academic Research Destroy Alpha?
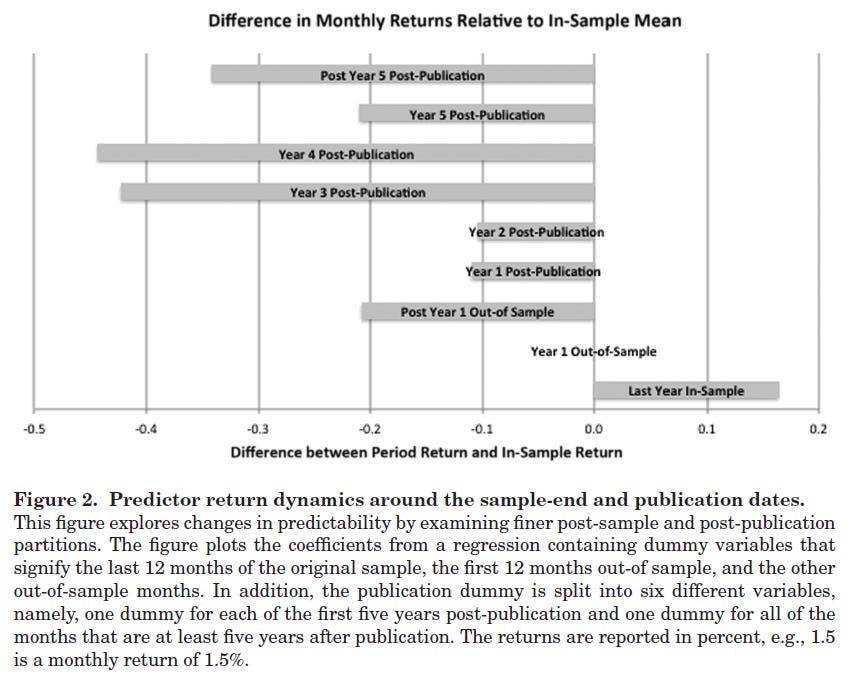
The more investors exploiting the same signals, the quicker any “edge” or alpha disappears. In an influential 2016 paper, McLean and Pontiff study the out-of-sample and post-publication returns of portfolios formed using 97 variables shown to predict cross-sectional returns. Their conclusions:
Portfolio returns are 26% lower out-of-sample
Portfolio returns are 58% lower post-publication
These results are consistent with investors learning about mispricing from academic publications and then exploiting it, thereby correcting the mispricing and eroding alpha.
Does Technology Destroy Alpha?

Before the late 1990s, computers were relatively expensive and not that powerful. Although the performance of 1990s computers seems ridiculous compared to that of a modern desktop, computers were becoming cheaper and more powerful at an exponential rate. At the same time, financial data were becoming more easily available due to regulatory changes, while changes in market structures (like decimalization in US markets) and higher level of automation in trading improved liquidity.1
The availability of powerful computing power at cheaper prices made it easier to research market “anomalies” and deploy computerized systems to trade quantitative strategies. This led to a sharp increase in quantitative research and trading activity in the early 2000s, which coincides with a noticeable decline in the profitability of quantitative strategies. This can be seen in several papers that backtest returns of long-short portfolios exploring anomalies. Across different types of strategies, including long-short anomalies, pairs trading, and brute-force data mining, the same pattern emerges: performance weakens markedly after the early 2000s.
Exhibit A: Long-Short Anomalies
The graph below is from a 2017 paper by Green, Hand and Zhang. It plots the cumulative returns of long-short portfolios formed based on forecasts using 94 characteristics that predict the cross-section of returns. Their results show that return predictability decreased sharply, especially among large stocks.
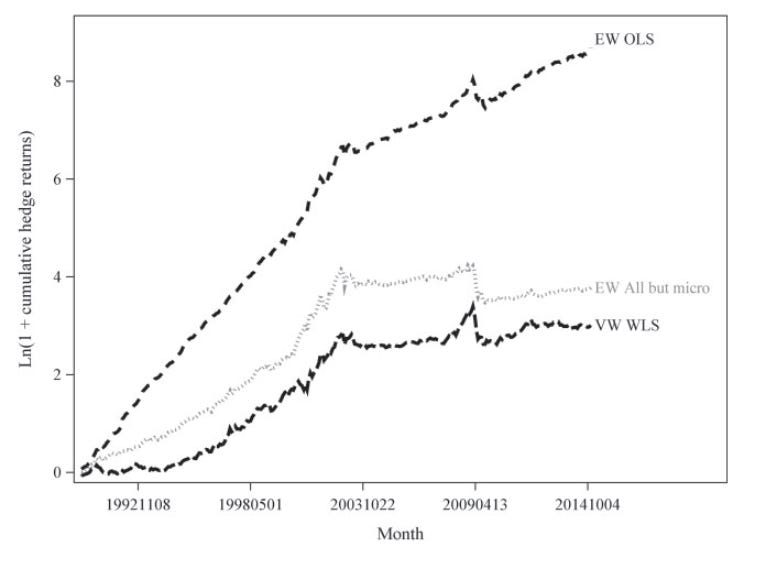
Exhibit B: Pairs Trading
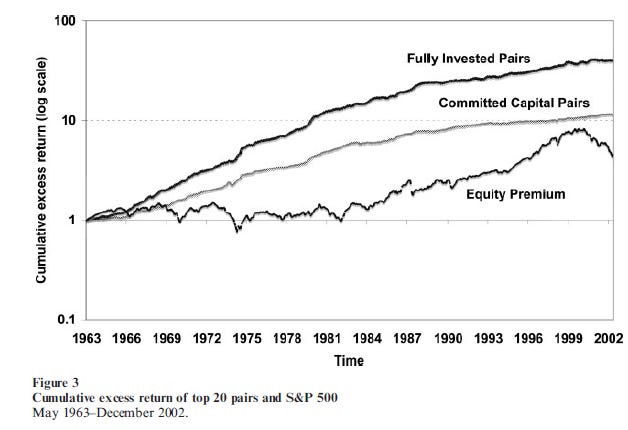
Pairs trading was being done already in the 1980s by a group of quants at Morgan Stanley. It was popularized in academic research in a 2006 paper by Gatev, Goetzmann, and Rowenhorst, who showed that a simple distance-based pairs trading strategy using U.S. stocks was profitable. Their sample ended in 2002, and this is the performance they reported:
Several subsequent studies document a sharp decline in profitability. The graph below is from a 2016 paper by Rad, Low, and Faff:
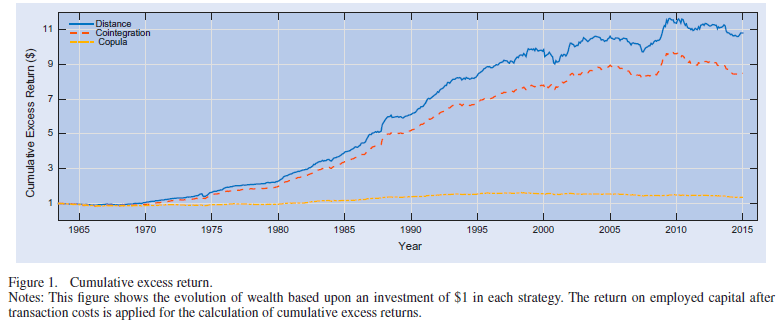
I tested the distance-based pairs trading strategy with more recent data (python code here) and found similar results:
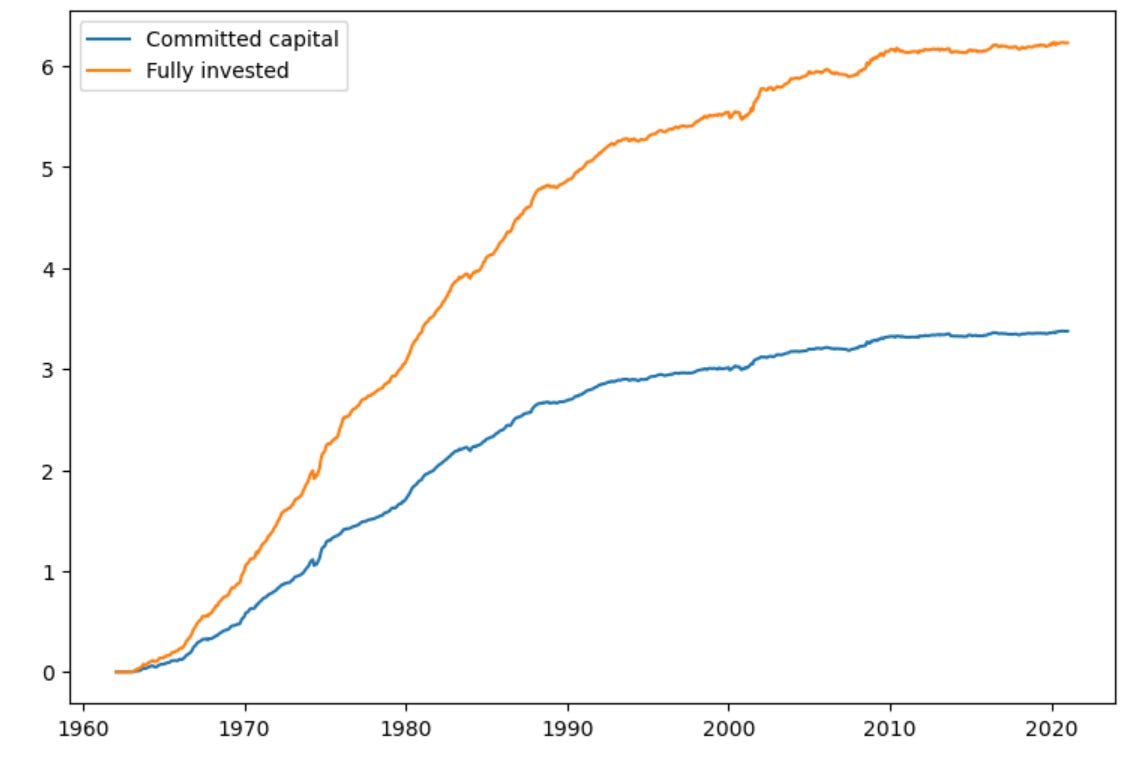
Exhibit C: Data Mining
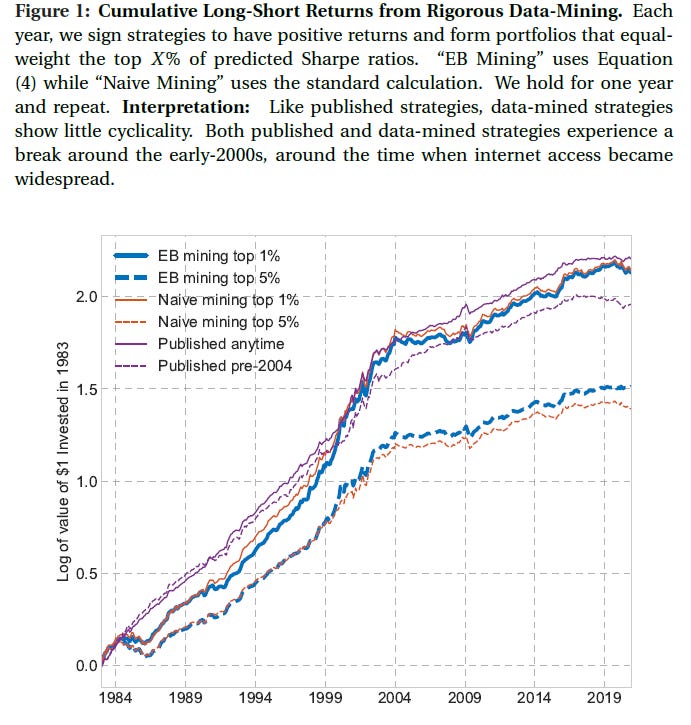
Some recent papers have explored brute force approaches that explore thousands of signals created using accounting and market data without explicit economic intuition. An example is the 2017 paper by Yan and Zheng. A recent working paper by Chen and Dim proposes a data mining approach using Empirical Bayes to explore 136,000 long-short portfolios constructed from accounting and market data in a way that mitigates look-ahead bias. Their data and code are publicly available. The graph below from their paper shows the cumulative returns of different portfolios that attempt to exploit the best signals. The same pattern of decline around 2004 can be clearly seen.
Machine Learning, Save Us!
The use of machine learning to predict returns is not new. What has changed is the feasibility of applying these methods at scale. Comprehensive studies of standard supervised learning models, such as those in Gu, Kelly, and Xiu (2020), were not practical in the 2000s: computing power was limited, and the necessary software infrastructure was neither widely available nor easy to use. Today, these methods can be implemented on a standard desktop using off-the-shelf libraries, and recent advances in AI further reduce the cost of building and testing such models. More sophisticated approaches, however, can be harder to replicate, due to high computational cost or model complexity.
Recently, several papers have tested the use of machine learning (ML) methods in return forecasting. In general, these studies suggest that ML can improve return prediction. Here are some examples:
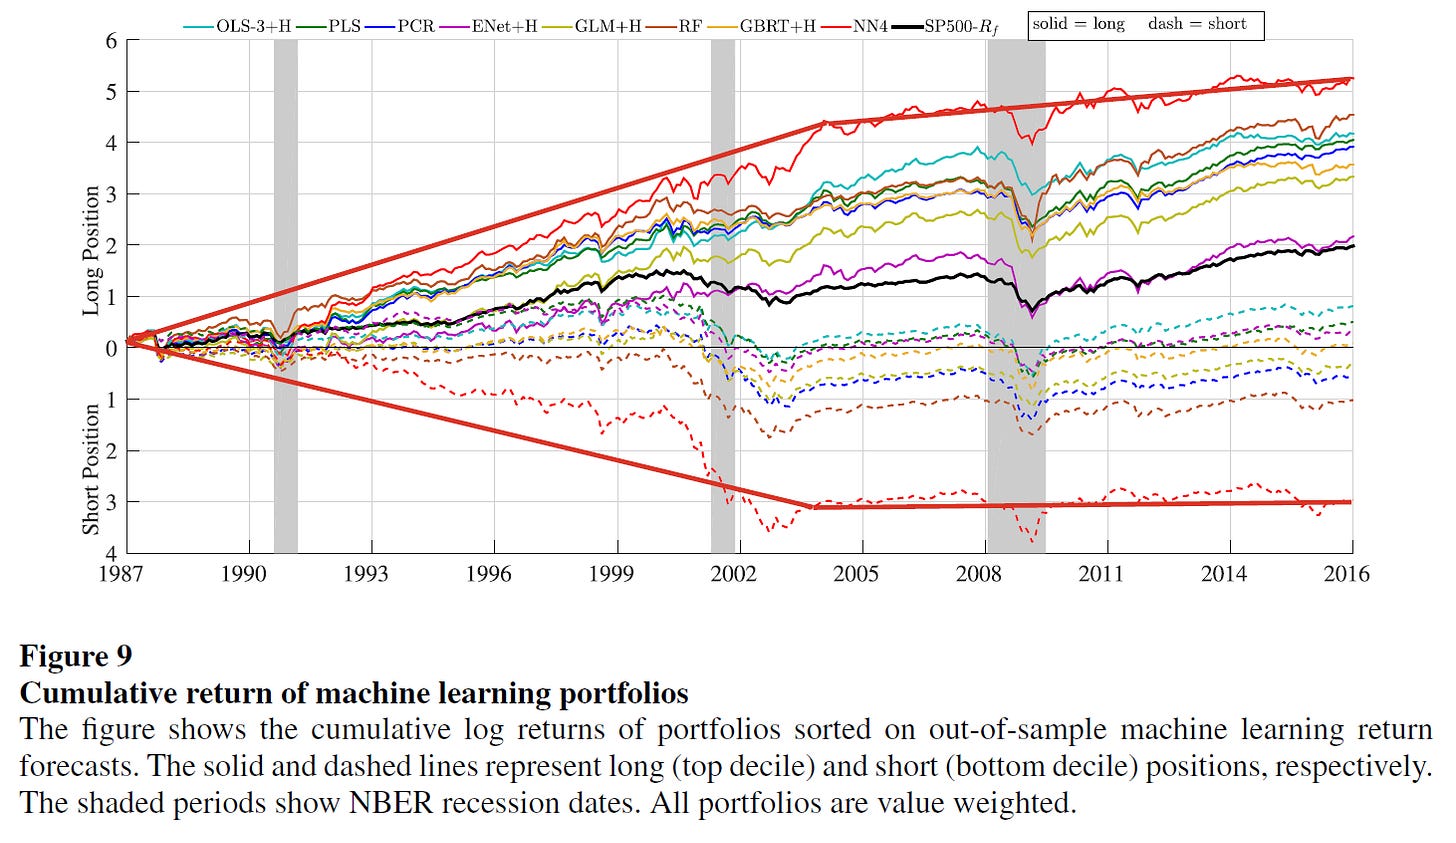
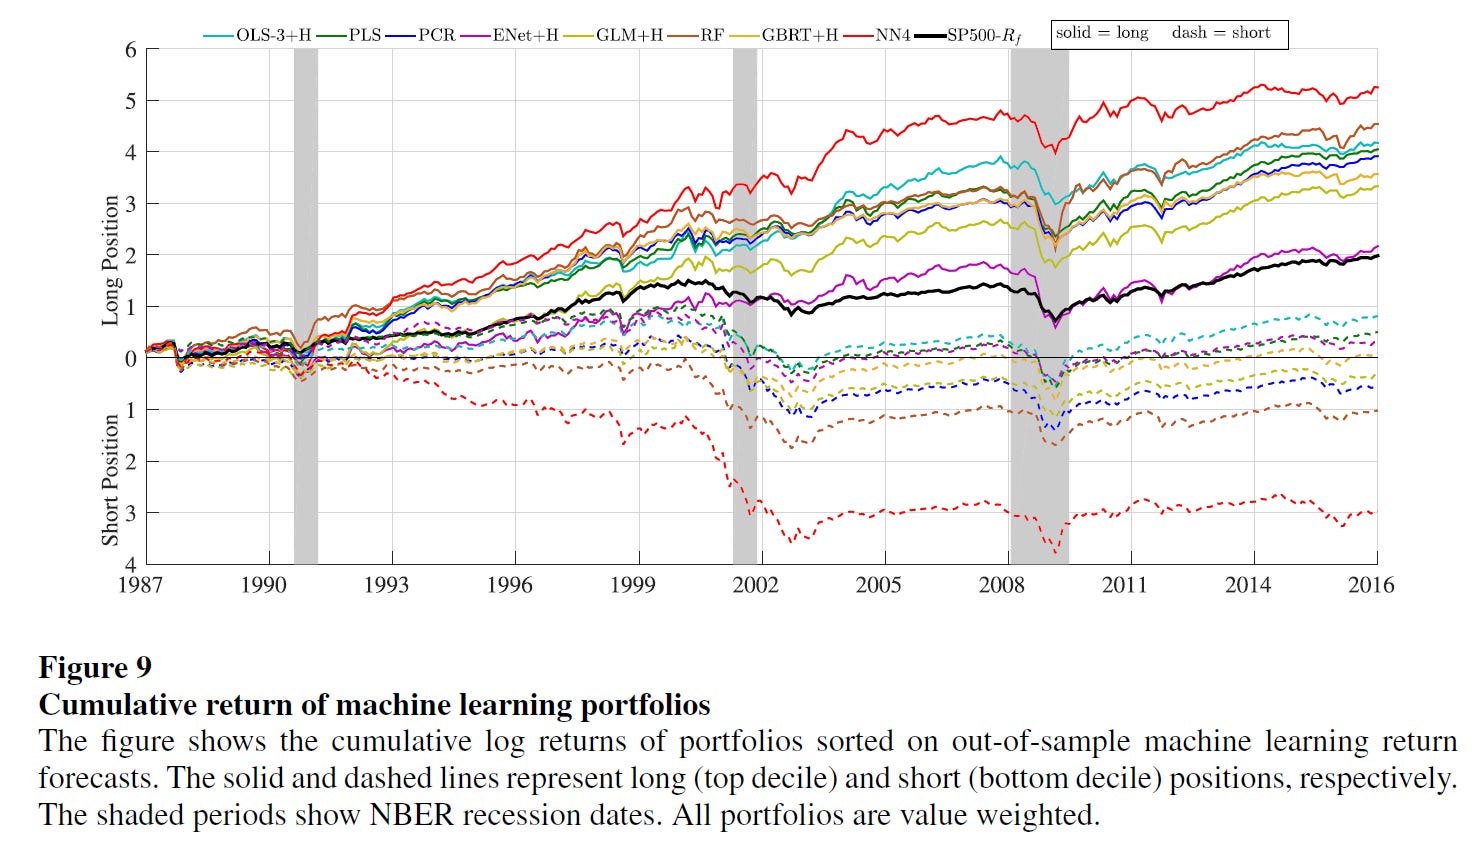
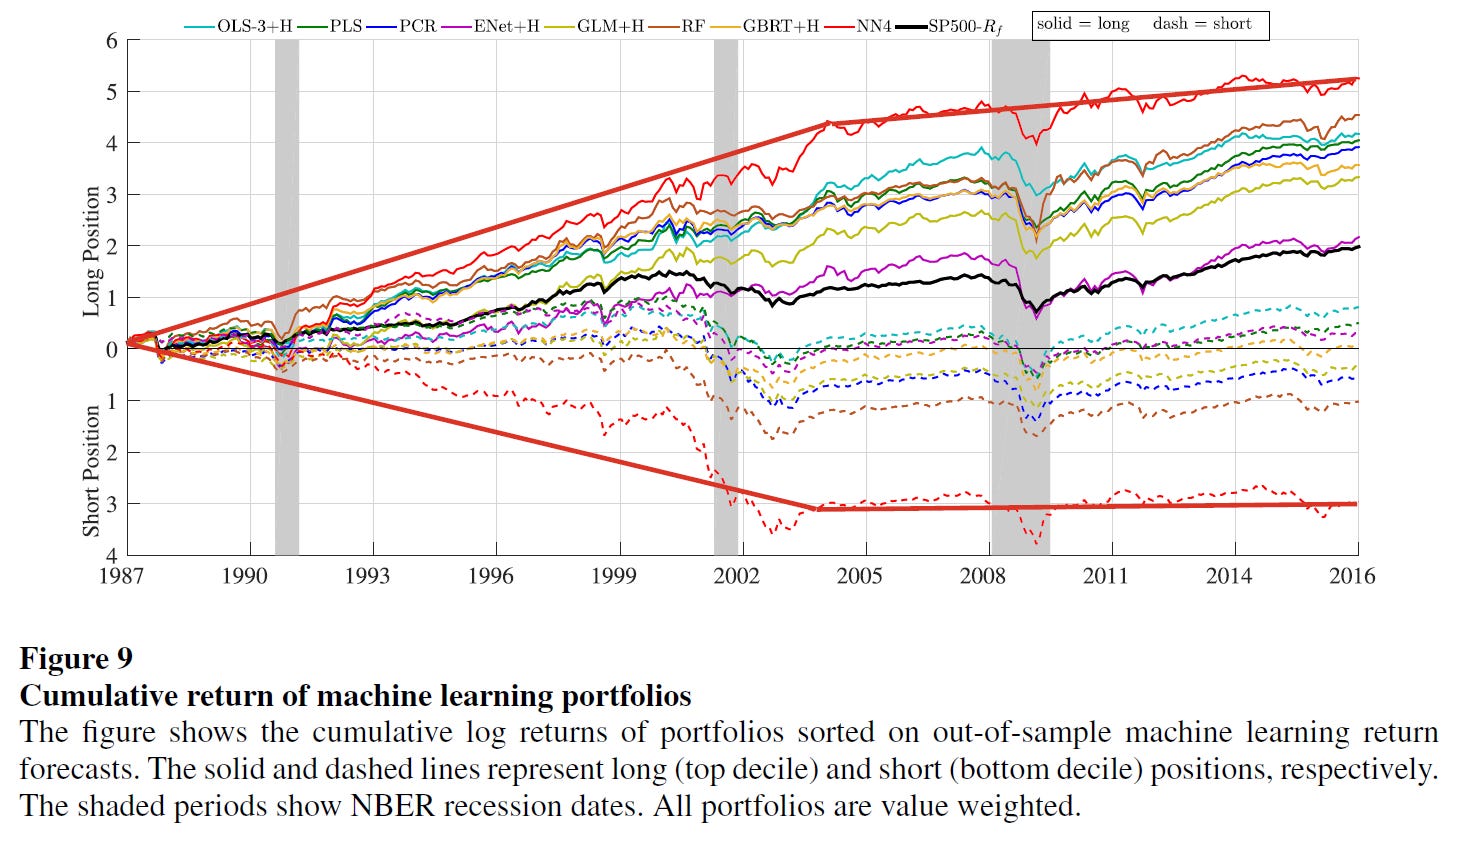
Gu, Kelly, and Xiu (2020): study several supervised learning models to forecast U.S. returns. The graph below is from that study:
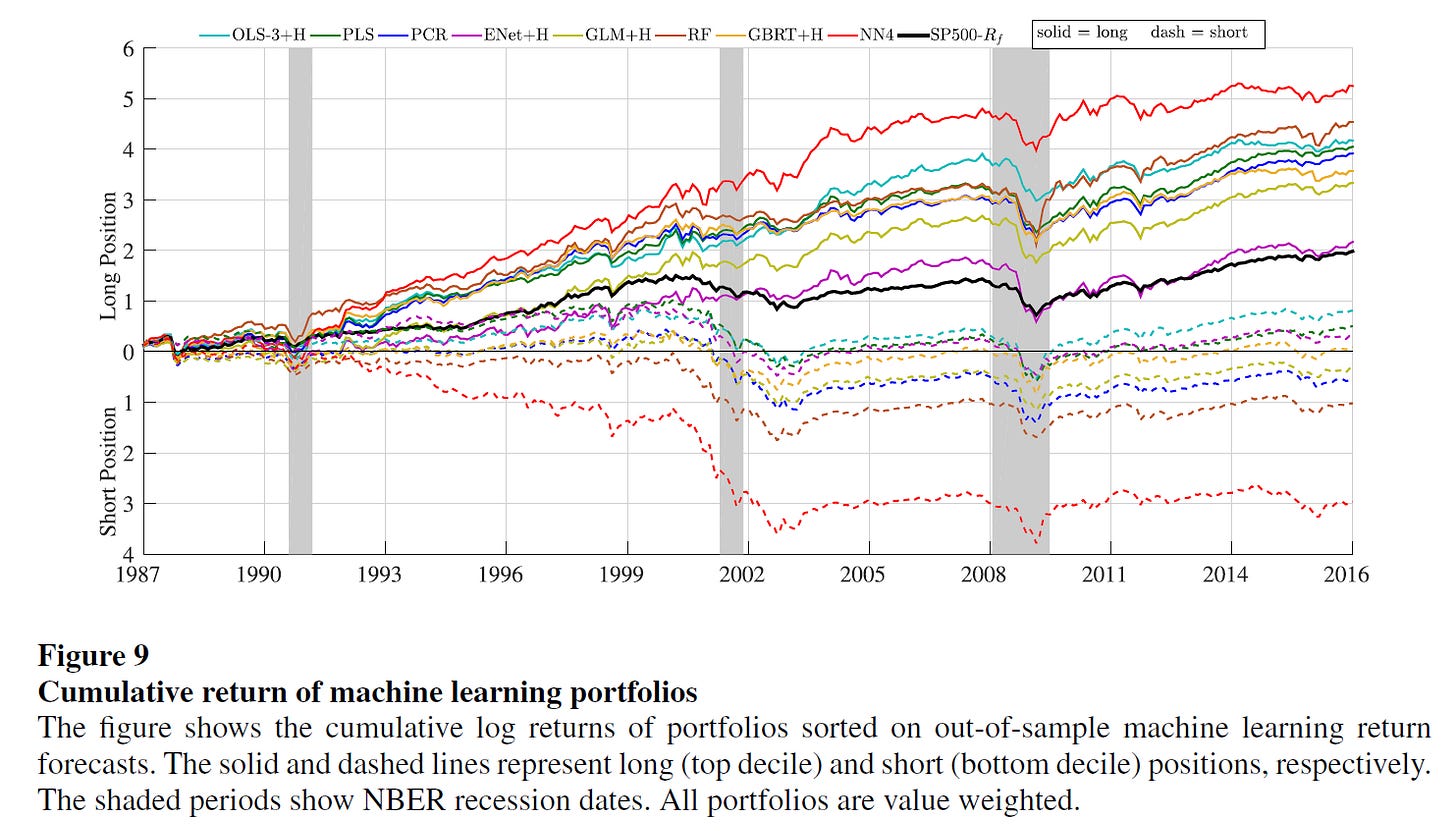
The full-sample results in their paper seem impressive. Their strongest performing model, NN4, delivers an average long-short return of 2.26% per month with a standard deviation of 5.80%, which gives an annualized Sharpe ratio of 1.35. Unfortunately, they don’t have a graph with the long-short cumulative returns. However, a visual inspection of the NN4 long and short legs in the chart above suggests that the performance may have also deteriorated in the post-2004 period, which suggests that the edge obtained via typical supervised ML is much weaker in that period.
Jiang, Kelly, and Xiu (2023) use convolutional neural networks to learn trends directly from images of charts and predict the probability of stocks going up. They train models using data from 1993 to 2000 and forecast and simulate trading strategies from 2001 to 2019. They report very high Sharpe ratios even after accounting for transaction costs (e.g., up to 4 at weekly frequency).
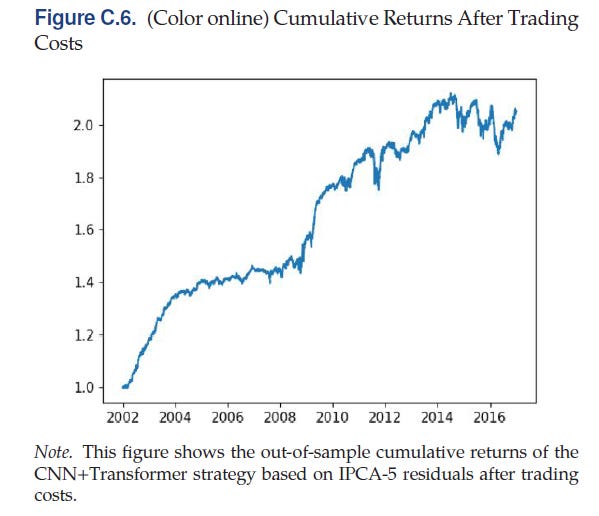
Guijarro-Ordonez, Pelger, and Zanotti (2025) create a framework for statistical arbitrage using deep learning. They use a 3-step approach. In the first step, they use a latent factor model to find portfolios of similar assets. In the second step, they apply a convolutional transformer to extract time series signals. In the last step, they use these signals to develop trading strategies. They find after-costs Sharpe ratios of up to 1.24 for statistical arbitrage strategies. The graph below shows the after-cost cumulative performance of one of their strategies.
AI, Save Us
LLMs are the latest candidate for restoring outperformance. There are hundreds of papers that attempt to apply LLMs directly to predict price movements. I’m not particularly excited about that avenue of research for a few reasons. First, LLMs are, fundamentally, next token predictors, so it’s not surprising that they can find some signals by looking at annual reports or social media sentiment, because past research has shown that there is some signal in those sources. In that sense, it’s difficult to sort out if LLM-based strategies create fundamentally new signals, or rather compress and recombine information already explored in the literature. Second, LLMs haven’t been around for very long and the technology is still evolving, so we can’t do long-term studies and it’s very difficult to prevent look-ahead bias.
Nevertheless, in my view, AI will impact quantitative investment through other channels:
Speeding up research and data mining significantly.
Lowering the barriers to building and deploying quantitative trading systems.
There is an enormous amount of information emerging on the first channel on a daily basis, and the technology continues to evolve at a high pace. AI is being aggressively used by both academics and practitioners to find the next asset pricing anomaly/trading strategy. This will produce an unprecedented increase in the “discovery” of trading signals, but I would also expect a similar increase in the speed of alpha erosion.
Regarding the second channel, AI agents can significantly lower the entry cost for software development. Although this does not come without risks, it is likely to bring more participants into quantitative and systematic trading, including even retail investors. While the impact of retail investors is likely to be small, their growing participation still contributes to increased competition for the same signals.
If this view is correct, AI does not fundamentally change the nature of return predictability, but it accelerates the process. More computing power, more data, and more participants all point in the same direction: faster discovery of signals, and faster erosion of any associated alpha. What remains are not easily exploitable anomalies, but more persistent sources of returns, such as risk premia, structural frictions, and edges related to implementation, capacity, or scale that are difficult to replicate.
In that sense, although it becomes easier to build systems to try to beat the market, the equilibrium implication is the opposite: markets become harder to beat, faster.
Although algorithmic trading overall seems to improve liquidity, things can quickly change during bad times.