Pockets of Predictability (Post #4)
A series of short articles on finance research replicability. On this issue: can cross-sectional anomalies be used to predict the market?

On this issue of Pockets of Predictability, I discuss the 2022 paper “Anomalies and the Expected Market Return”, by Dong, Li, Rapach, and Zhou (DLRZ), as well as the 2024 paper by Cakici, Fieberg, Metko, and Zaremba (CFMZ), who performed a large scale replication of DLRZ using both U.S. as well as global markets data.
I’ll also discuss the kinds of methodologies used in these papers (and in most papers in the time series return predictability literature) to assess forecasts from a statistical and economic point of view.
At the end of the article, I include python code that downloads data from Amit Goyal’s website and from Open Source Asset Pricing, runs predictive regressions with both sets of predictors, and compares results.

Linking Cross-Sectional Anomalies and Aggregate Stock Market Prediction
Stock return predictability is a topic of interest to both practitioner and academics. There is a large literature on this topic, split along two lines of research:
Cross-sectional predictability: focuses on identifying which variables explain return differences among stocks. This literature created the so-called factor zoo, which I’ve mentioned a few times in previous posts. This is a large collection of asset pricing anomalies, i.e. long-short portfolios whose returns can’t be explained by typical asset pricing models.
Time-series predictability: focuses on identifying which variables can predict aggregate stock market returns and the market risk premium.
The research question in DLRZ is whether there is a link between these two strands. In other words, do long-short anomalies from the cross-sectional literature help predict aggregate stock market returns? If true, this would imply that signals traditionally used to rank stocks in the cross-section also contain information about aggregate market returns.
According to DLRZ’s finding, the answer is yes. They study the predictive ability of 100 long-short anomaly portfolio returns using different techniques such as dimension reduction and shrinkage, and report statistically robust return predictability. In addition, they find that market timing strategies based on out-of-sample forecasts using anomalies generate economic gains relative to a benchmark.
DLRZ’s paper uses a standard predictive regression setup common to many papers in the time series predictability literature. Therefore, it’s useful to briefly review the predictive regression framework used in these studies.
The Predictive Regression Setup
Many papers in this literature use a predictive regression model:
where rM,t is the excess market return on month t and xt-1 contains lagged predictors. In words, we are using information available at time t−1 to forecast next month’s market return.
Different types of predictors have been tested in the literature, including macroeconomic variables, technical indicators, sentiment measures etc. A few details that matter in practice:
The predictive regression can be estimated using a rolling or an expanding window scheme. Expanding (or recursive) estimation is more common, but if coefficients are unstable or if there are structural breaks, it can be problematic. While rolling estimation doesn’t solve these kinds of issues, it can attenuate their effects.
Many papers truncate forecasts at zero, which is justified by the idea that the equity risk premium shouldn’t be negative. This generally improves the performance of forecasts, but remains an ad hoc procedure. Some papers try to enforce this directly into the model using Bayesian methods for example.
The predictable component in aggregate market returns is very small. Adding more than a few predictors to x causes performance to degrade quickly unless some type of regularization is used.
The consensus in the literature is that predicting aggregate market returns is very difficult, and most predictors do not work out of sample. A key reference is Goyal and Welch (2008). An updated version with more predictors is Goyal, Welch, and Zafirov (2024). I use data from this paper later to compare with the performance of long-short anomalies.
Statistical Performance
In the time-series return predictability, forecasts are usually evaluated relative to a prevailing mean forecast, which is just the average market excess return using observations available at forecast formation. Another way to think about this forecast is as a regression of excess returns onto a constant. This benchmark assumes that the equity risk premium is unpredictable, so it’s a natural benchmark. Papers usually report the R2OOS statistic to compare the performance of a given forecast with that of the prevailing mean forecast. Consider a forecast of the excess market return at time t, using information until time t-1:
The forecast error is given by
Let MSFE1 be its mean squared forecast error:
Likewise, we can define the prevailing mean forecast at time t and calculate its mean squared forecast error, which we’ll call MSFE0. The R2OOS statistic is defined as:
This statistic can be interpreted as the proportional reduction in MSFE for the competing forecast relative to the prevailing mean benchmark. To test if a forecast has better predictive ability compared to the prevailing mean benchmark, papers often use the test by Clark and West (2007), which tests the null of equal predictive ability between the a parsimonious model with only a constant (i.e, the prevailing mean benchmark) and a larger model that includes predictors. The null hypothesis of the CW test is equal predictive ability: MSFE1=MSFE0, which corresponds to R2OOS=0.
Economic Performance
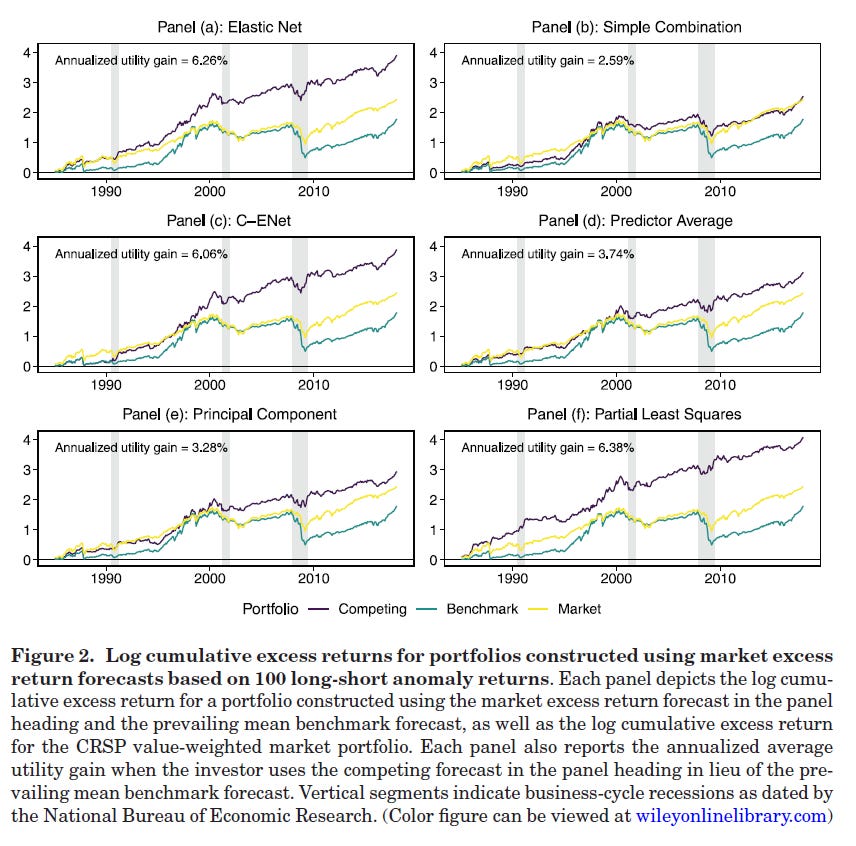
Economic performance is generally assessed based on market timing portfolios that solve a mean-variance optimization problem at each point in time. Specifically, the problem is a capital allocation one: based on the available forecast, decide how much to allocate to the overall market and to the risk-free asset. The problem at the end of month t can be written as:
where γ is the investor’s coefficient of risk aversion, usually set to γ=3 in most papers. The solution is
Although the solution is exact, this formula can lead to very large positive or negative weights. Because of that, weights are typically capped to some interval, such as [-1, 1.5] or [0, 1.5] if the researcher wants to restrict portfolios to be long only. Most papers in the literature estimate the variance of returns using some rolling window. DLRZ use a 60-month rolling window for this purpose. Once the optimal weights are calculated, the timing portfolio returns over the out-of-sample period are calculated in the usual way by multiplying weights by returns. Many papers report the annualized difference in realized utility as a measure of the economic performance. The average realized utility (or certainty equivalent return) of the investor’s portfolio based on the optimal weights is calculated as
where the required inputs are the average realized return and the realized variance of the optimal market timing portfolio over the out-of-sample period. Likewise, we can define the corresponding quantity based on the prevailing mean forecast:
Finally, the quantity below expresses the increase in the investor’s utility from using the forecast relative to using the prevailing mean benchmark:
If this quantity is positive, it means that the portfolio constructed using the model forecast performs better economically than the portfolio that relies on the benchmark forecast based on averaging past prior returns.
DLRZ: Data and Methodology
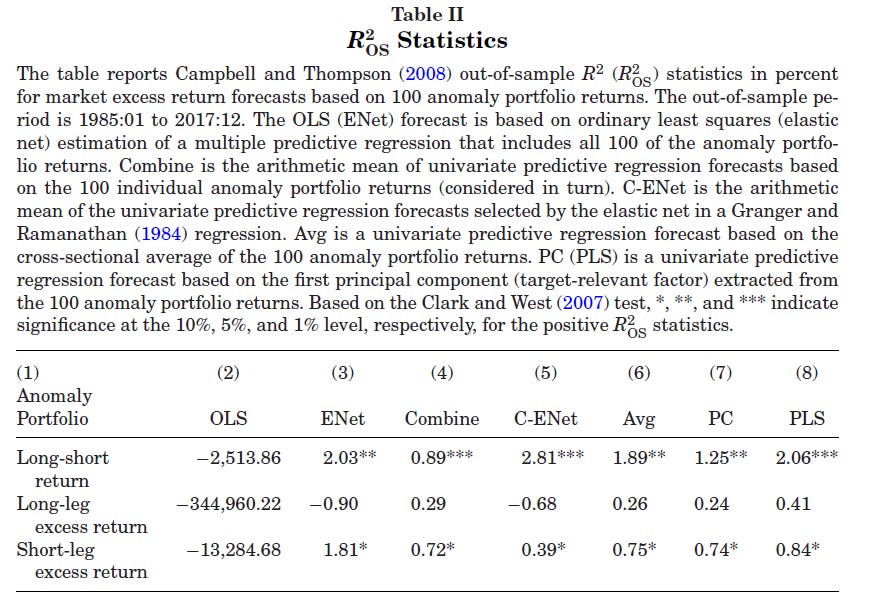
Now let’s move on to the specific results in DLRZ. The authors estimate the predictive regression discussed previously where xt-1 contains the lagged returns on the 100 long-short anomalies returns constructed using CRSP data. The market excess return is the CRSP value-weighted market return minus the risk-free return and the sample period goes from 1970 to 2017.
In terms of forecasts, DLRZ construct the following ones:
Conventional OLS: run a multiple regression of excess returns on the lagged 100 long-short anomalies returns. This is expected to perform poorly due to overfitting.
ENet: same but using elastic net, which regularizes the coefficients and should alleviate the overfitting concern.
Simple Combination: run univariate regressions and average the forecasts. This is essentially another kind of shrinkage as in Rapach, Strauss, and Zhou (2010).
Combination ENet: similar to the simple combination, but instead of averaging directly over all univariate forecasts, they first run univariate regressions on the training window, leaving 5 years as a holdout sample. Then, they run an elastic net regression of excess returns onto univariate forecasts on the holdout sample, and finally they average univariate regressions forecasts only for the regressors that were selected by the elastic net.
Predictor Average: instead of using the 100 individual anomalies, first take their average and then run a univariate regression of excess returns on this average.
Principal Component: run a unvariate regression of excess returns on the first principal component of the 100 anomalies.
PLS: uses the Partial Least Squares approach to construct a target-relevant factor that has maximum correlation with the market excess return.
The estimation of these models is done using an expanding window scheme. The initial estimation window is the 10-year period from from 1970:01 to 1979:12. The period from 1980:01 to 1984:12 is used as a holdout sample for the Combination ENet method. One peculiarity of DLRZ is that they only use the holdout period for the elastic net combination method. For all the other models, including the standard ENet, they use the combined training and validation windows at each point.
DLRZ: Results
The main results of DLRZ are that the long-short anomalies have strong predictive ability for aggregate market returns. Their main table for statistical performance shows that, while conventional OLS has terrible performance (as expected), several approaches deliver high R2OOS close to 2% or even 3%.
In addition, several forecasts using the anomalies deliver significant economic gains relative to the prevailing mean benchmark or a buy-and-hold strategy:
These results are puzzling to some degree, because previous research had shown that firm characteristics themselves appear to have very limited ability to predict aggregate returns. Specifically, a 2023 JFQA paper by Engelberg, McLean, Pontiff, and Ringgenberg looked at whether average values of firm characteristics that are widely used to explain cross-sectional returns (or form portfolios), such as price-to-earnings, could be used to predict aggregate market returns, finding little evidence that this was the case.
There is much more in the paper (it’s a JF paper after all!), including an economic rationale based on mispricing that could explain why the anomalies should have predictive ability. But what is important for this series is the replication angle.
CFMZ: The Replication
In their 2024 RF paper, Cakici, Fieberg, Metko, and Zaremba (CFMZ) performed a large scale replication of DLRZ using both U.S. as well as global markets data.
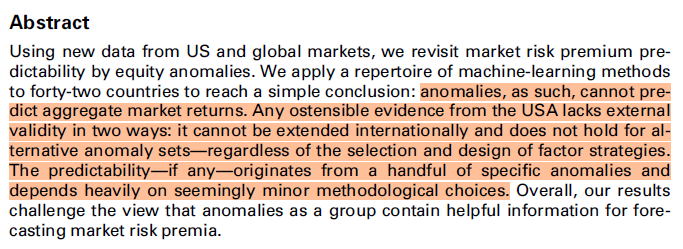
Their conclusion is quite strong:
I first came upon this paper after having come to a similar conclusion myself (at least regarding the U.S. market), based on my own attempts to replicate the results in DLRZ. I was working on a paper on this topic, and decided to include the average of a large cross-section of long-short anomalies as a predictor. I relied on data from Chen and Zimmermann’s Open Source Asset Pricing, and found that their average had little to no explanatory power, and only under certain design choices, such as using an expanding window.
CFMZ analyze this in a much more detailed way using a large dataset with anomalies from the U.S. and 42 other countries.
CFMZ: Replication in Other Markets
The first result of CFMZ, using up to 153 anomalies in other countries and similar machine learning forecasts as those used in DLRZ, is that the average R2OOS across the 42 countries are negative or close to zero. The market timing portfolios formed using the anomalies also underperform naive benchmarks and buy-and-hold strategy.
CFMZ: Replication in Alternative Anomaly Sets
CFMZ try to replicate DLRZ’s results using 4 datasets:
Open Source Asset Pricing
DLRZ’s dataset, which is provided in their replication package.
Their conclusion:
Among all the tested samples, the return predictability holds only for one in four: the original sample of Dong et al. (2022). No other anomaly set generates any evidence of a similar pattern.
CFMZ also tested:
whether the selection of anomalies matters: they tested random samples of 100 anomalies from the various sets, finding large variations in R2OOS but the same overall conclusion, even for the best sets. In particular, they also found that the set of anomalies used by DLRZ contained a higher percentage of anomalies with significant predictive ability, and their predictive ability exceed that of similar variables from other samples. Finally, they show that predictive ability in DLRZ set is unusually concentrated in anomalies related to issuance.
whether anomaly construction can affect the results: they tested different options for methodological choices used to create the anomalies, such as weighting schemes, winsorization rules, and cut-off points. Their conclusion: only a few implementations showed some predictive ability that is comparable to that of DLRZ.
DLRZ go Global
In a separate paper (not yet published), Dong, Li, Li, Rapach, and Zhou reassess the predictive power of anomalies, this time using global anomalies data for 43 non-US countries. Their story is that, while anomalies have limited predicited power at the country level (which seems to agree with CFMZ), they show strong predicitive power when aggregated to the supranational level. While on this paper they also use alternative anomalies data from Jensen, Kelly, and Pedersen (2023), they focus exclusively on non-US countries.
A Python Workbook to Investigate Anomalies for Market Prediction
Keep reading with a 7-day free trial
Subscribe to Systematically Biased to keep reading this post and get 7 days of free access to the full post archives.