Your Trend Strategy is Just a Weighted Average of Past Returns
How Popular Trend Indicators Embed Views on Return Dynamics

Trend following is one of the most widely used systematic trading strategies. There’s solid evidence that trend following has worked across long periods of time, different markets, and is particularly useful during periods of crisis1 There are endless ways to implement it, but many popular trend indicators turn out to be much closer cousins than they first appear. In fact, once you rewrite them in return space rather than price space, a lot of trend-following rules are just weighted averages of past returns. What differs across rules is not the basic idea, but the shape of the weights.
There are countless trend indicators around, but most are variations of simple ideas like:
Compare the current price with price n periods ago.
Compare current price with a moving average of prices.
Compare a fast moving average with a slow one.
Time Series Momentum Rules
Take a simple rule based on the first idea. We can express the signal as follows:
That means we should go long when the current price is above the price n periods ago, and short otherwise. We can express the same rule by looking at the cumulative returns, which is the time series momentum signal used in many of the papers on trend following:
where rt-n,t is the cumulative return over the last n periods. How we define returns here matters. If we work with simple returns, then rt-n,t must reflect compounding. Alternatively, we can write the signal as a sum of past price differences. If we use log returns, then is simply the sum of the last n one-period log returns:
Price-SMA Crossover
Another commonly used trend following indicator is the price-simple moving average crossover. This is based on comparing the current price with a moving average of past prices. Suppose we compare the current price with a simple moving average (SMA) of the past n prices. For simplicity, let’s assume we’re working with log prices pt=log(Pt):
The SMA is defined as:
Then the price/SMA crossover signal can be written as (see the end of the post):
Therefore, the price/SMA crossover signal is equivalent to a weighted average of the past n-1 returns, where the weights are linearly decreasing.
Price-EMA Crossover
What about replacing the simple with an exponential moving average (EMA)? The signal then becomes
where
Following the same strategy used for the price-SMA signal, we can show that
Noting that multiplication by λ>0 doesn’t change the sign of the signal, the price-EMA crossover rule is equivalent to using the sign of an EMA of returns:
Moving Averages in General
Valeriy Zakamulin and Javier Giner have several papers that look at trend following in general, and alternative formulations of different rules in terms of returns:
This paper by Valeriy Zakamulin provides results for other kinds of signals based on different types of weighted averages.
In a subsequent paper with Javier Giner, the authors compare time series momentum and different moving average strategies.
In a more recent paper, Zakamulin and Giner look at optimal trend strategies under a two-state regime switching model.
I particularly like the chart below from the last paper, which shows the shape of the weights on past returns for different trend following rules:
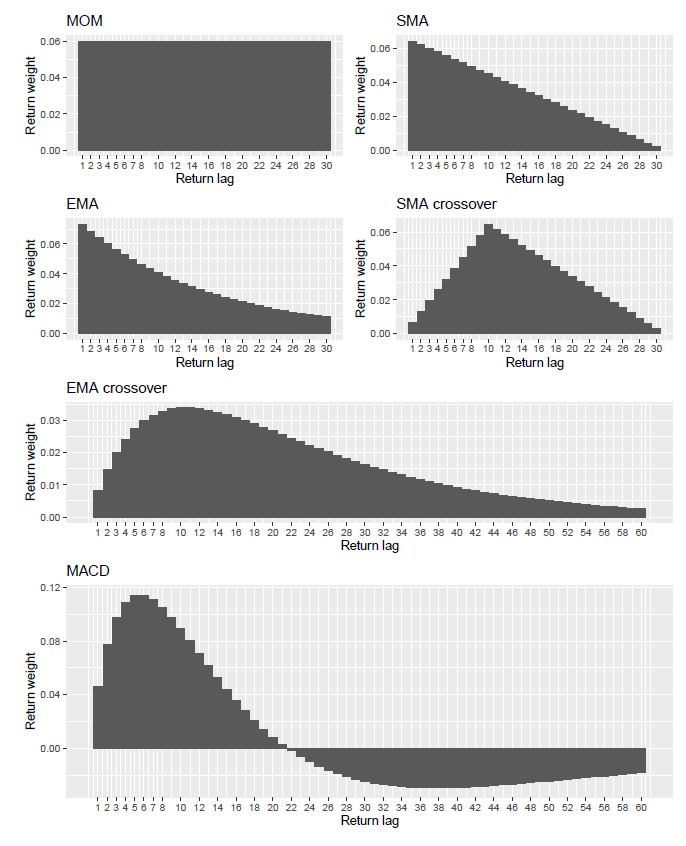
The three cases I mentioned above (time series momentum, price-SMA crossover, and price-EMA crossover) are shown in the chart as MOM, SMA, and EMA. Zakamulin and Giner distinguish the following cases:
Constant weights: using the time series momentum (MOM) is equivalent to using an equal average of past returns.
Declining weights: using price/SMA or price/EMA crossover is equivalent to overweighting the most recent returns.
Hump-shaped weights that underweight the most recent and most distant returns: this pattern describes different cases like SMA and EMA crossovers.
Shapes where the sign of the weights can alternate between positive and negative. This is the case for the moving average convergence/divergence (MACD) indicator. In the last case, the rule negatively weights distant returns, suggesting return reversal at long horizons.
Trend Indicators and Return Dynamics
This matters because those weighting schemes are not just technical details. They embed views about the dynamics of returns. Equal weights assume that all past returns inside the lookback window matter similarly. Declining weights put more emphasis on recent information. Hump-shaped weights imply that the most informative lags may be somewhere in the middle, while sign-changing weights, as in MACD, effectively combine short-run continuation with long-run reversal. So when we choose a trend rule, we are not just choosing an indicator. We are implicitly choosing a model of return persistence.
Appendix: Deriving the Price-SMA Crossover Rule
The price-SMA crossover signal can be expressed as:
In the first passage, we use the fact that pt can be written as a sum with n terms equal to (1/n)pt, which allows us to put pt inside the sum. In the second passage, we used the fact that the term for j=0 is equal to 0. Next, we use the fact that
Substituting this above gives
Expanding this sum, we can see that each return rt-i appears for all j=i+1,…,n-1, that is, exactly m-1-i times. Therefore,
The signal in the price/SMA crossover using n prices reduces to a weighted average of n-1 returns. We could re-index the rule by the number of returns entering the signal. Let k=n-1, then the rule becomes
Here are some references with links:
Moskowitz, T. J., Ooi, Y. H., & Pedersen, L. H. (2012). Time series momentum. Journal of financial economics, 104(2), 228-250.
Hurst, B., Ooi, Y. H., & Pedersen, L. H. (2013). Demystifying managed futures. Journal of Investment Management, 11(3), 42-58.
Hurst, B., Ooi, Y. H., & Pedersen, L. H. (2017). A Century of Evidence on Trend-Following Investing. The Journal of Portfolio Management, 2017, vol. 44, no 1, p. 15-29.
Lim, B. Y., Wang, J. G., & Yao, Y. (2018). Time-series momentum in nearly 100 years of stock returns. Journal of Banking & Finance, 97, 283-296.
Yang, K., Qian, E., & Belton, B. (2019). Protecting the downside of trend when it is not your friend. The Journal of Portfolio Management, 45(5), 99-111.
Harvey, C. R., Hoyle, E., Rattray, S., Sargaison, M., Taylor, D., & Van Hemert, O. (2019). The best of strategies for the worst of times: Can portfolios be crisis proofed?. The Journal of Portfolio Management, 45(5), 7-28.
Rubesam, A. (2022). The Long and the Short of Risk Parity. Journal of Portfolio Management, 48(4).